About
My formal training in Cartography has taught me to look at the world through the lens of how people, places, and thing interact and how they influence each other. This means even with the smallest details I am considering how they fit into the bigger picture. Consistently and incrementally evaluating how to make process flow more efficiently and where to focus time and energy to get the biggest value add.
Featured Experience
Company Rebrand: After multiple multi-national companies came together under one umbrella parent company work needed to be done to bring the diverse brand landscape in harmony. I was one of a few brand champion leaders to lead an effort to harmonize our approach to visuals.
The first step of this process was to understand the scope of visuals and how they were being produced by each legacy company. This took the form of an in depth survey which covered a wide range of graphic types.
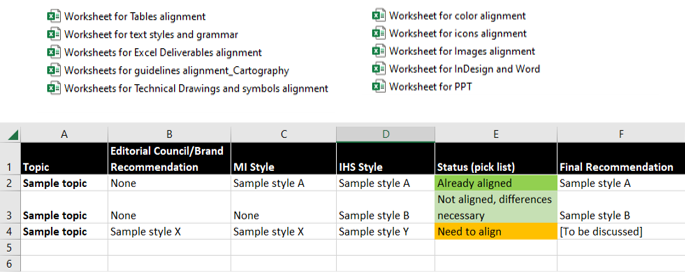
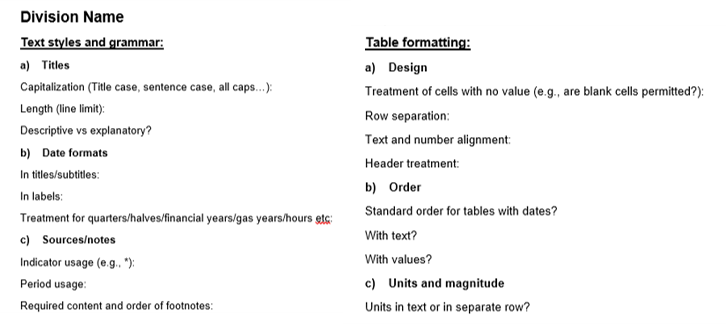
This was then converted to a set of excel file that were used in small organized working groups to assess where alignment could occur and where differences were needed.
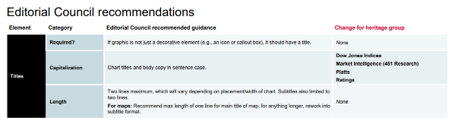
These results were presented to senior leadership across the organizations for final adjustments and approvals.
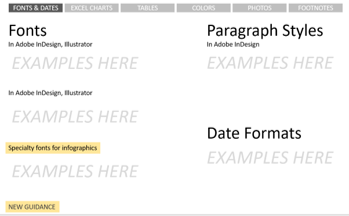
Once final feedback was collected, plans got under way to produce the final style guides. Wireframes were created and then final products produced.
The final step in the process – implementation, took place in the form of multi-level training sessions across the organization for all involved from senior leadership, to editors and reporters, to visualization specialists.
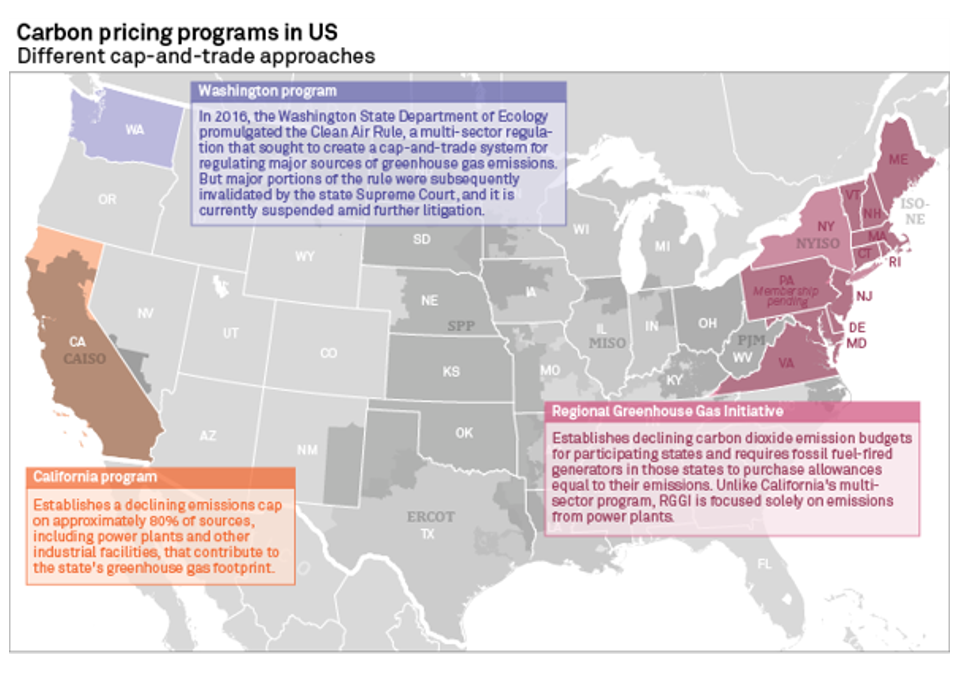
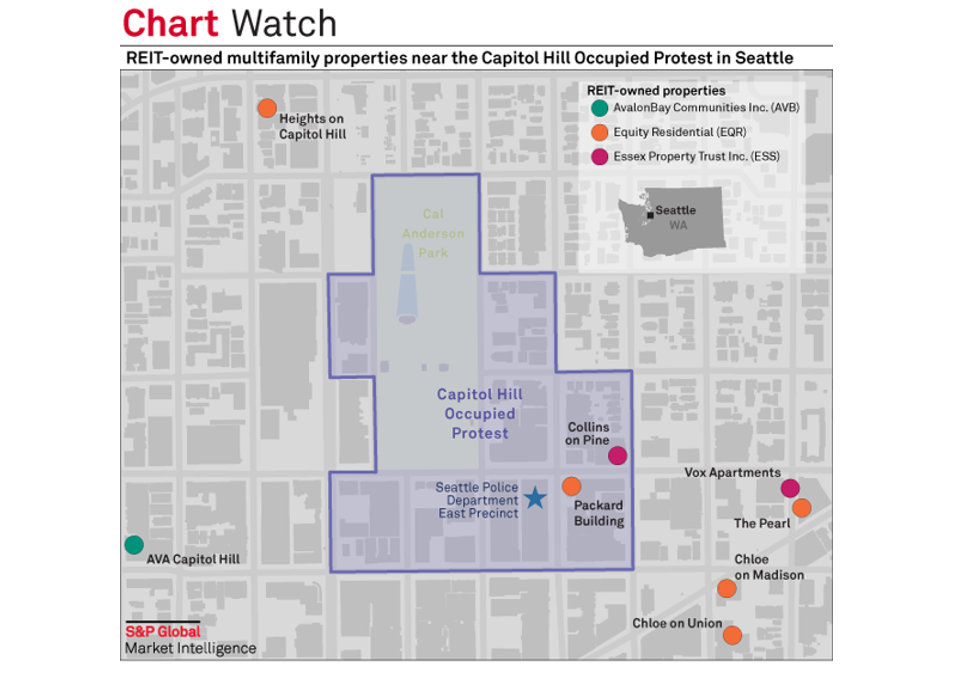
Editorial and Visual Story Telling: : Information can be conveyed through a variety of formats – digital, print, news stories, visuals, tables – none of that matters unless deliberate work is put in to ensure the story being conveyed is the one meant to be told.
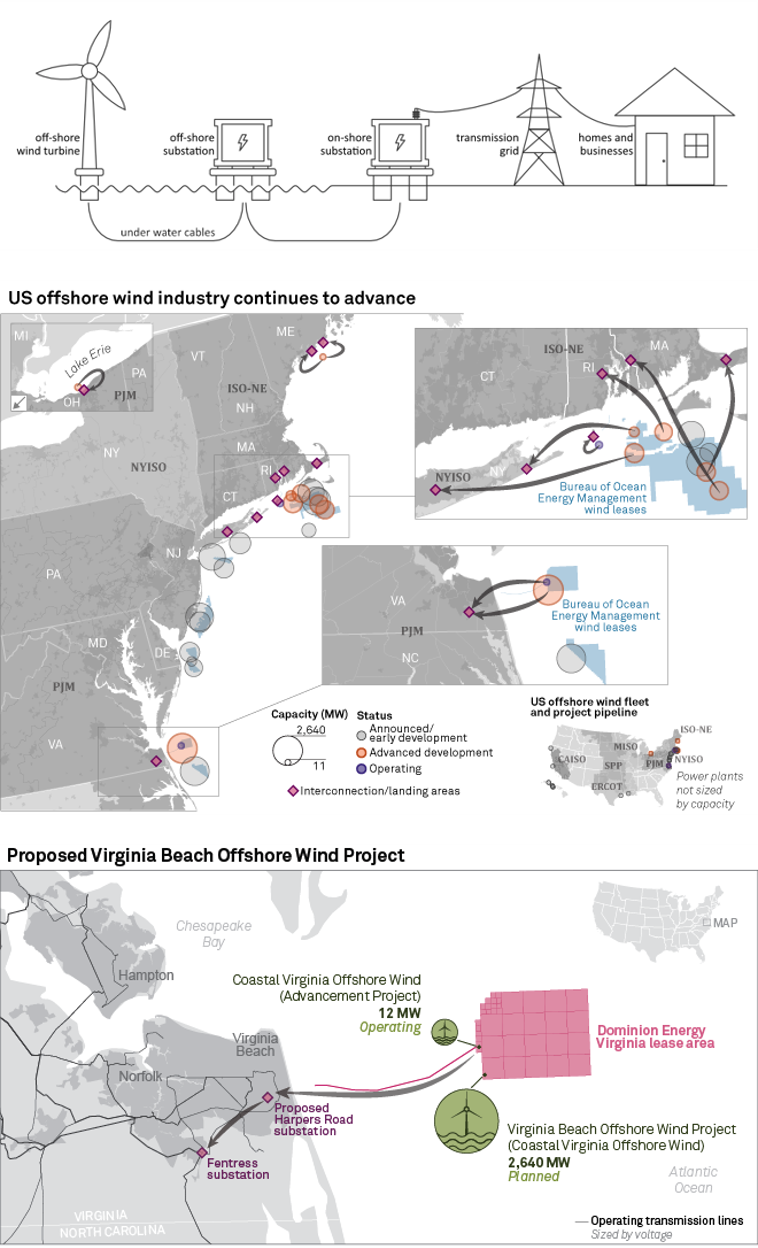
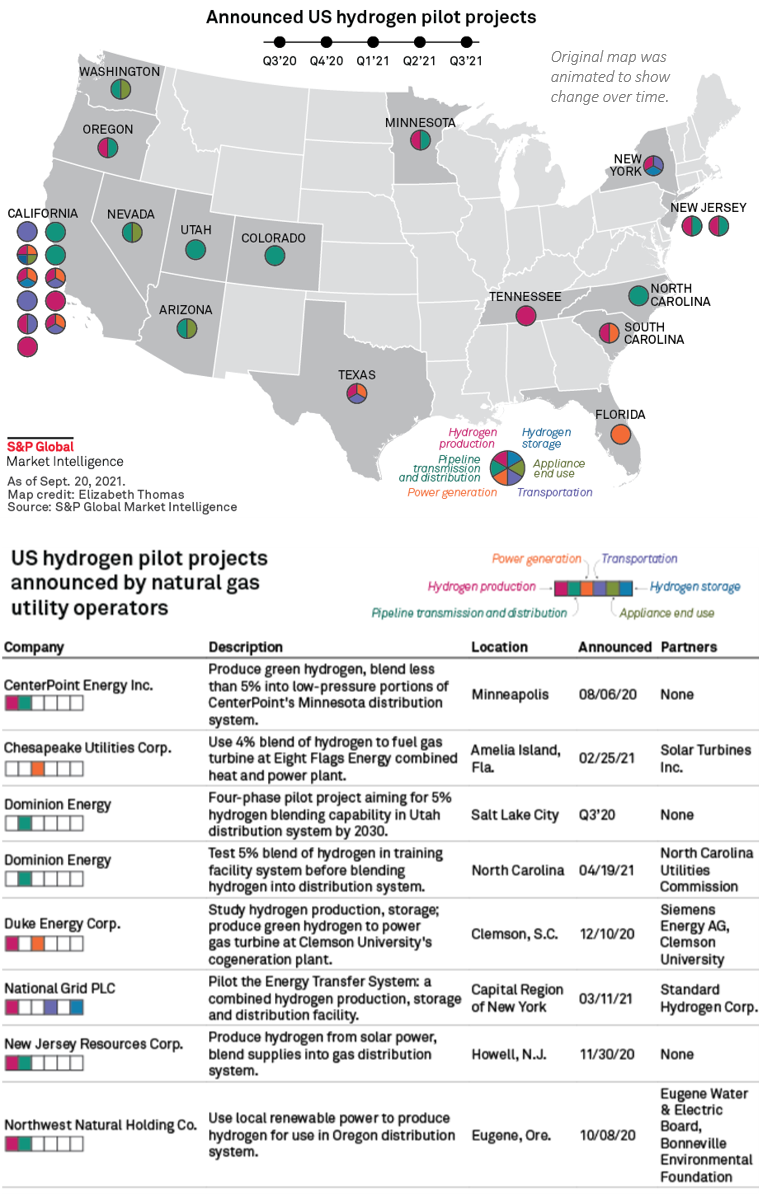
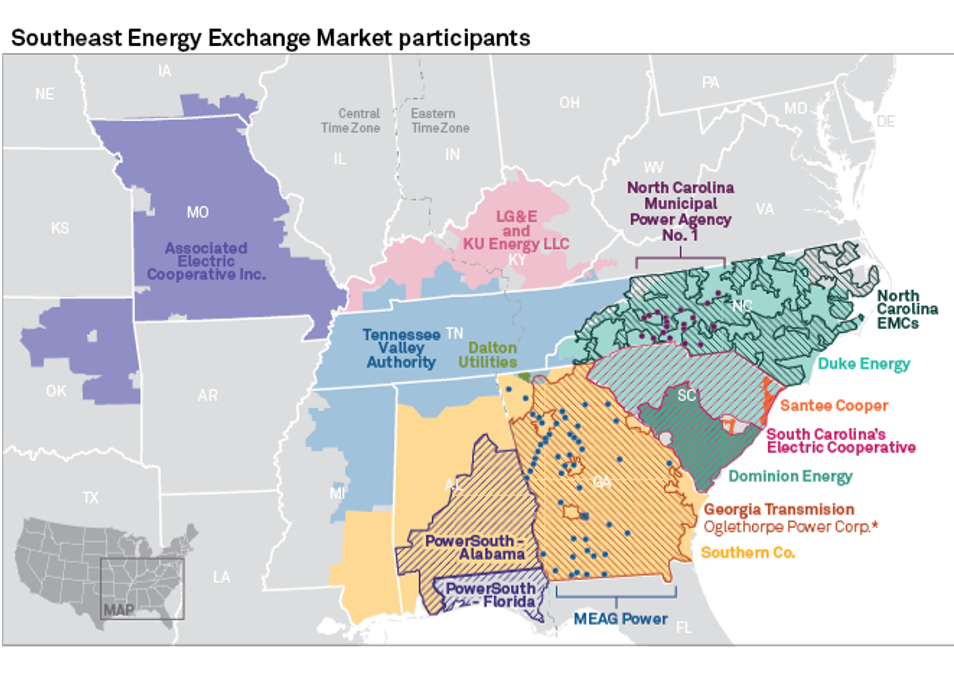
These graphics were a part of a campaign telling the story of offshore wind. Originally the maps contained only the point data – power plants and sub stations. Upon a deeper discussion the core of this series was about where wind energy was being collected and how/where it will be entering the power grid. Usually, we would attempt to show this with transmission line but many of these projects are so early in development that a creative solution needed to be reached.
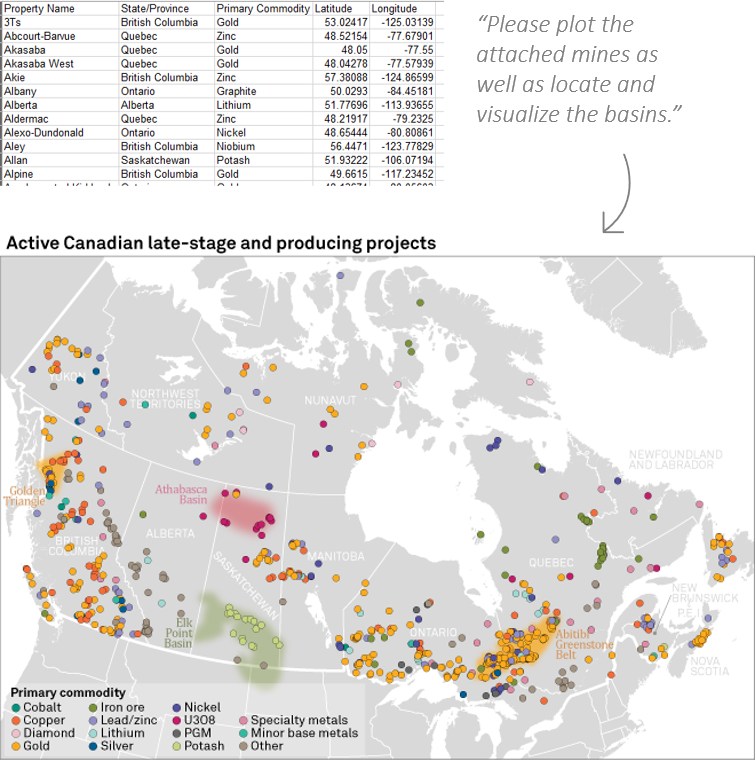
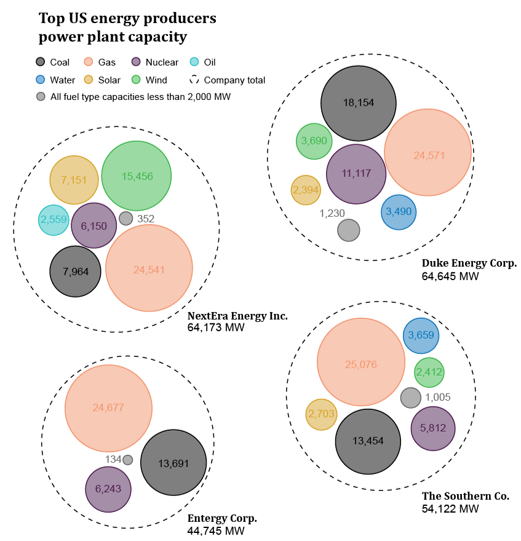
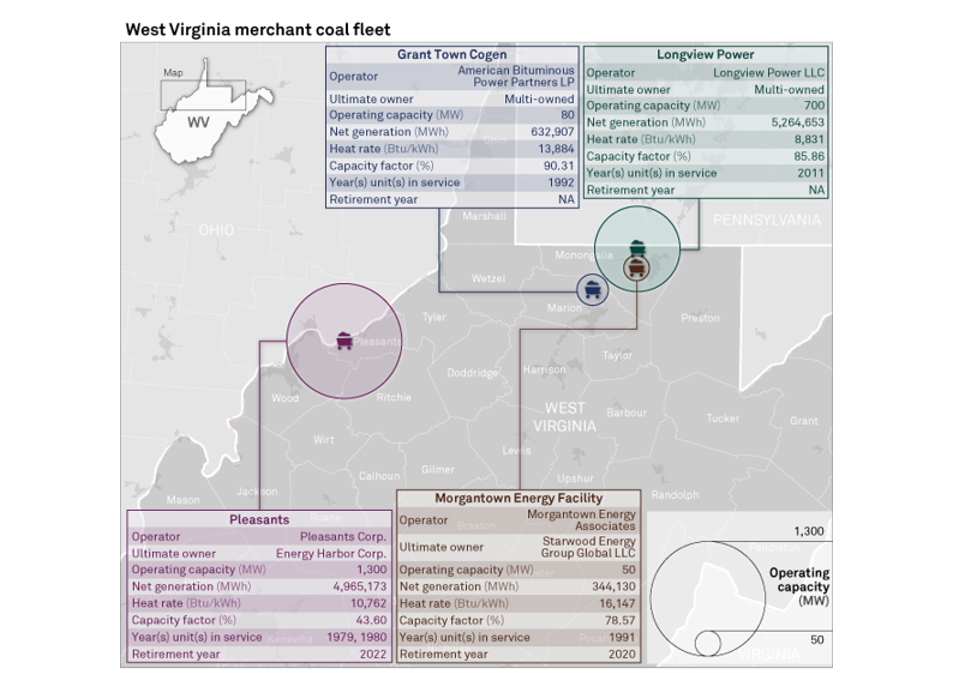
On the surface this is something that seems simple and straight forward – plotting points and polygons on a map. The challenge here is we needed to find a way to visually express ambiguity. Mineral basins in the ground aren’t solid material that ends at a given boundary. We also didn’t want these basins to overpower the graphic but they needed to be visible and relatable to the mine locations and be represented in a way to associate to their mineral types.
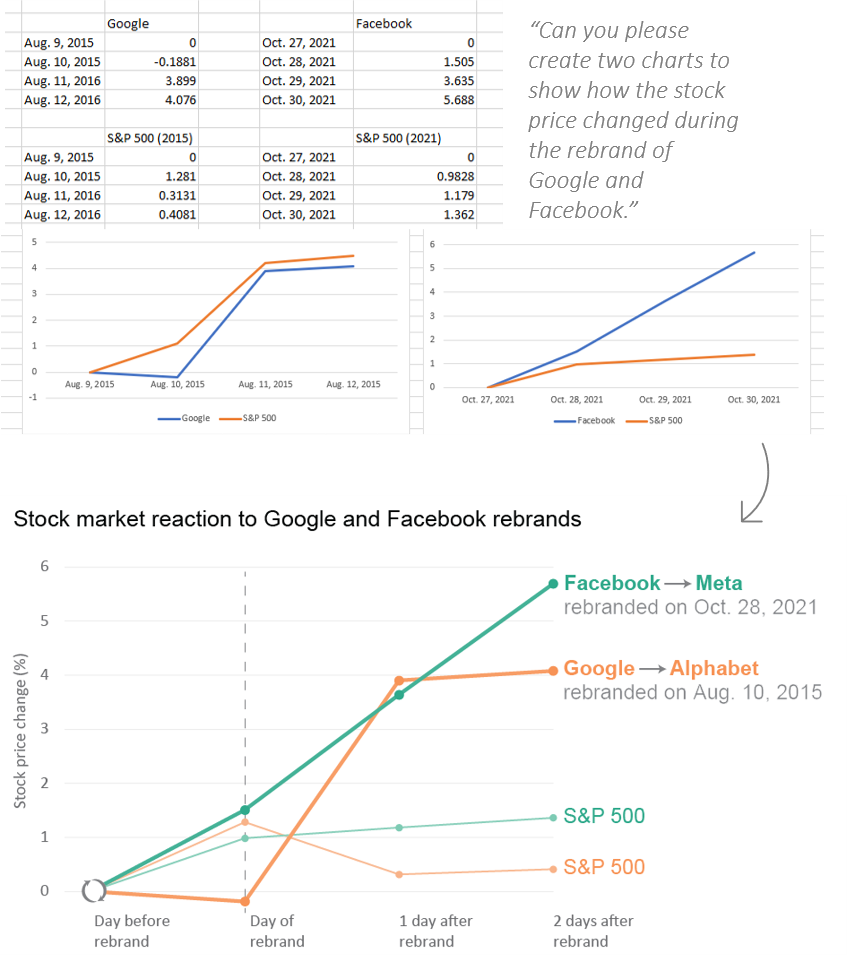
While on the surface this graphic seems simple – two line charts. After a discussion with editor, reporter, and data journalist I was able to help ground the story into the below graphic. The importance of comparing Facebook vs. Google and each verses their position in the greater marker was more vital to the story than the actual dates in which they occurred separately.
While on the surface this graphic seems simple – two line charts. After a discussion with editor, reporter, and data journalist I was able to help ground the story into the below graphic. The importance of comparing Facebook vs. Google and each verses their position in the greater marker was more vital to the story than the actual dates in which they occurred separately.
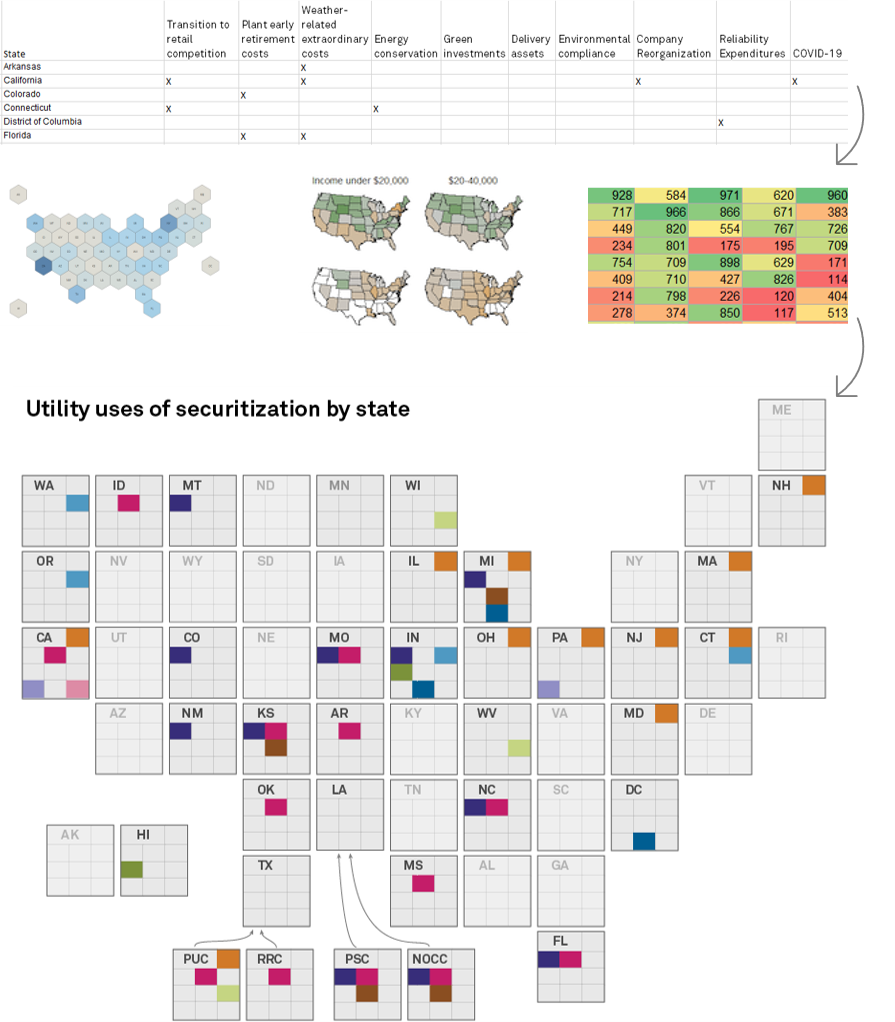
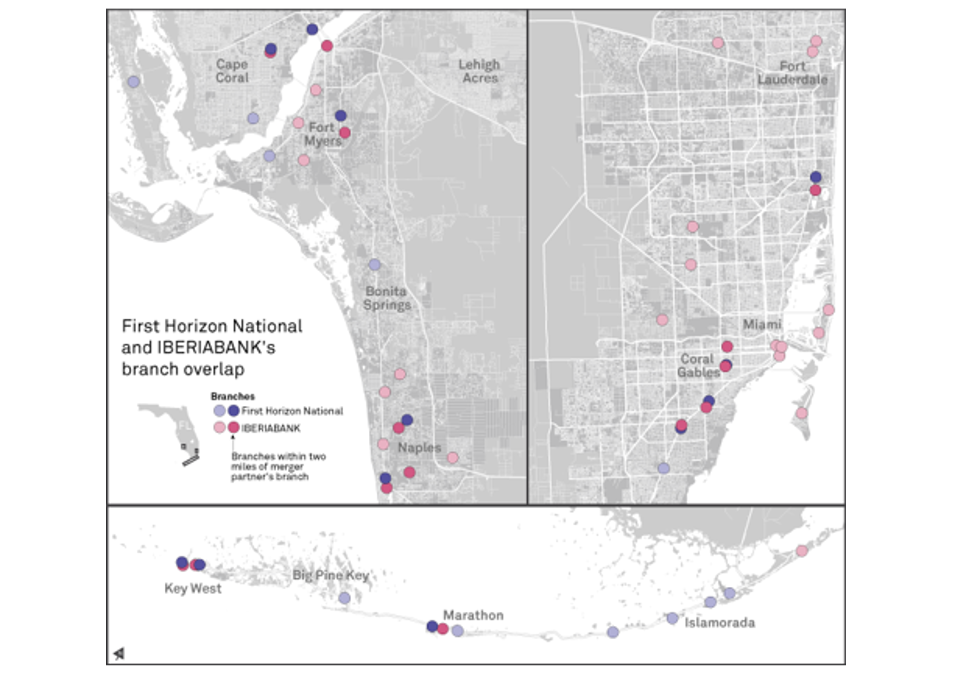
“I would like to map each state with the unique subset of 10 categories they fall into.” The instant I opened this dataset my first thought was there was no way this could be a map. Working in a product with very restrictive size limitations makes putting this much data on the page difficult at best. After some research I was able to combine 3 visualization techniques together in a way to effectively visualize the data.
“I would like to map each state with the unique subset of 10 categories they fall into.” The instant I opened this dataset my first thought was there was no way this could be a map. Working in a product with very restrictive size limitations makes putting this much data on the page difficult at best. After some research I was able to combine 3 visualization techniques together in a way to effectively visualize the data.
Leadership: I have been fortunate enough to be able to have many strong leaders throughout my career. During my experience leading global teams in a largely remote setting, I have developed a few core principles I lead by.
Authenticity: Above all else, I believe everyone should be their authentic self. As a leader, I strive to set this example and support others to do the same.
Clear Communication: At their core, a leader needs to be precise and clear especially in times of uncertainty. Conveying messages, roadmaps, and expectations clearly is critical to fostering a healthy team environment.
Stive For Excellence: As a leader, it is my responsibility to set the example for my team and my colleagues. I do this by implementing small changes that will take “good enough” at least one step further.
Include Everyone: Inclusion to me means more than just collaboration. I believe in giving team members ownership of the team they belong to. I strive to listen to all ideas and viewpoints before making decisions. I believe in giving team members the opportunity to work on stretch assignments while being there to support them if they run into obstacles.
Be A Thought Leader: It is my responsibility as a leader to be a center point for many moving pieces. It is my goal to help lead the team into the future as smoothly and effectively as possible. Creating content campaigns, rethinking workflows, being the networking champion that connects people with a specific skill to people in need of that specific skill are all critical to effective leadership.
Seek Knowledge: I believe the key to success is curiosity. Being curious what other people are working on, curious about new techniques, curious about how you can improve yourself and do better. This can look like continuing education, mentorship, peer-to-peer training and consistent and continual thirst for knowledge.
Company And Team Development: Grounded in both LEAN and Six Sigma philosophies I have participated in steering the future of both teams and companies through change and development.
Team management: I have a proven track record in streamlining team workflows while also developing buy-in to goals that lead to team growth and success. I also have experiences with adaptability and change management as I’ve guided teams and management through restructuring.
Policy Development and Improvement: With my strong eye for detail, I am keenly interested in streamlining operations and improving consistency. I have expertise in communicating process changes for quick understanding and implementation. I also have an eye for managing risk, as I have been intimately involved increating policies for disputed territories, data management, style, and error management.
Client First Management: Having a deeply engrained culture with client-centric usability top of mind is critical to success. My work experience has given me the opportunity to develop policies and support teams that deliver optimal availability and performance of products to clients.
Portfolio
Skills
I have utilized these skills in industries such as energy, ESG, healthcare, insurance, real estate, and natural resource management in the corporate, non-profit, and government spaces.
TOOLS
Design:
Adobe Suite: Illustrator | InDesign | Photoshop
Affinity: Designer | Publisher | Photo Tableau
Mapping:
ESRI: ArcMap | ArcGIS Pro
MaPublisher
Google Earth
Agile Workflow Management:
Visual Studio Team Services (vsts)
Microsoft Team Foundation Server (tfs)
Appian - Pathfinder
Jira
Product Development:
Figma
LucidChart
Miro
Client And Data Management:
Salesforce
SharePoint: Management of large file database
Microsoft Teams
Excel and PowerPoint: Dashboards | Brand formatting | Pivot tables | Functions
DESIGN
- Visual storytelling
- User centered design
- Data visualization
- Large Format Plotting
- Print and Digital Design
- Brand Development and Implementation
- Typography And color theory
- Books Reading
- Editor and Copy Editor Skills
LEADERSHIP CAPABILITIES
- Workflow Management and Process Redesign
- User Story Development
- Design Workshop Facilitation
- Corporate Business Presentation Skills
- Data Management and Integration
- Workflow Documentation Development
- Data Metadata Development
- Software License Management
- Proficiency Leading Other with Skills In: Vba, Python, Api Interactions, Html, Css, Dashboarding, Javascript
Work Experience
NextEra Energy
GIS Specialist
June 2022 – Present
Remote: Juno Beach, FL
- Collaborated across technology teams and worked within Agile framework to begin integration of databases from on-premis servers to cloud Saleforce infrastructure
- Assisted in the management of the extensive backlog of requests using Jira
- Helped management team to develop a plan for evaluation of workflow and branding inconsistencies
- Implemented workflow and data documentation standards
S&P Global Market Intelligence
Senior Managing Cartographer
March 2016 – June 2022
Hybrid remote: Charlottesville, VA
- Worked in an editor capacity with news, industry, and marketing leaders to develop compelling and cohesive narratives using both text and graphics across platforms
- Collaborated cross divisionally between multiple visual teams, reporters, content creators, editors, and external clients to ensure consistency and accuracy across the product
- Lead design workshops with internal and external stakeholders to produce compelling visual stories to illustrate complex datasets and processes
- Participated within the Agile framework acting as the clients advocate to ensure client needs were met bridging the gap between our client management software, Salesforce, and Agile technologies
- Worked along side scrum teams to develop user stories for product improvements based on client needs and feedback
- Lead a global team of cartographers and designers helping them develop their skills and how to think differently and more creatively about the data and graphics they use
- Developed new brand standards, innovated graphic ideas, and ways to use data
National Park Service, Gateway National Rec. Area
Hurricane Sandy Recovery Data Visualization Specialist
Jan. 2015 – Feb. 2016
Staten Island, NY
- Primary designer on Gateway NRA General Management Plan graphics
- Lead team of seasonal interns to achieve business unit needs
- Developed and designed products based on client’s or park unit’s needs
- Designed public-facing pamphlets, presentations, and exhibit documents
United States Census Bureau
Cartographic Products Branch Intern
July 2014 – Nov. 2014
Washington, DC
- Intimate involvement with QA/QC on maps resulting from an automated process
- Used open-source software and data to complete various data and design problems
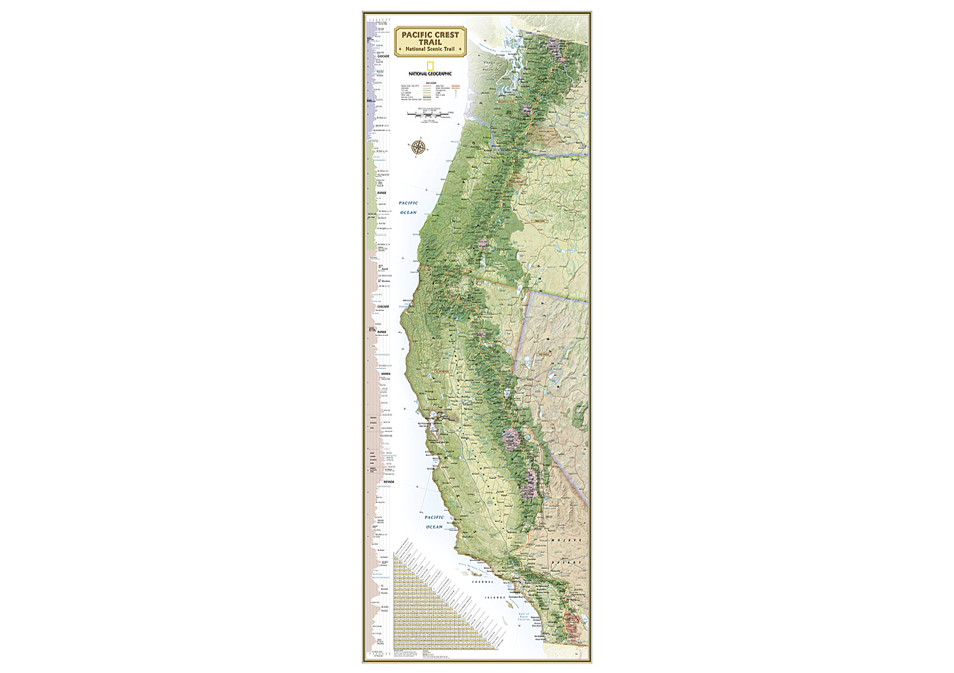
National Geographic Society
Maps Division Intern
Jan. 2014 – April 2014
Washington, DC
- Primary Cartographer on the Pacific Crest Trail National Geographic Map
- Worked with and organized numerous large datasets to produce a cohesive set of maps and graphics
- Worked with a team of editors and cartographers to complete various projects
Education
Continuing education works in progress: User-Centered Design (UX/UI), Digital Marketing, Organizational Behavior
Data Analytics & Visualization
Rice University
Bootcamp
Completion: 2022
Infographics and Data Visualization
Parsons School of Design
Certificate
Completion: 2021
Master of Arts, Cartography
University of Kansas
Research: Public perception of design
Coursework completed: 2015
Bachelor of Arts, Geography
Indiana University of Pennsylvania
GIS/Cartography
Graduation: May 2012